Cross Crude Oil

Cross Crude Oil 60 minute
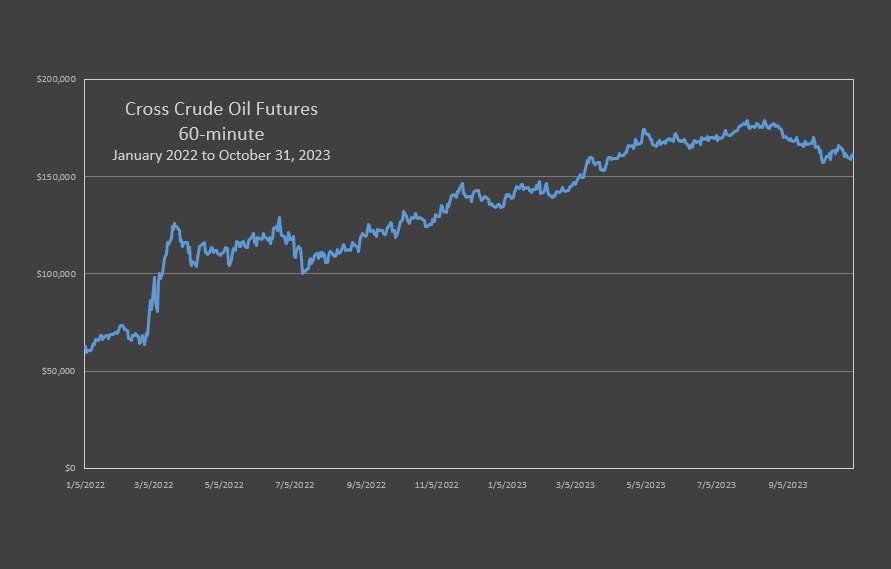
This is the equity curve and its statistical profile for the current Signal window. This covers data from 1-2-2022 through 10-31-2023.
It was built on a historical look back from January 2, 2013 through December 31, 2022 and was validated with our proprietary process which uses Walk-Forward Analysis..
For those who would like to trade Crude Oil futures with less risk, this strategy can be tracked on the full Crude Oil contact and executed on the micro CL.
This strategy can be purchased for $595. It requires Cross to run.
It can also be auto-traded for those who would like to benefit from this strategy without the need to purchase the software and manage the trading. Reach out via our Contact page - https://www.pardo.space/contact.
Current Performance
This is the performance of the Cross Alpha CL Signal workspace. This is the strategy that is traded.
The Signal strategies will often times have different parameters than the Static strategies. This is the result of walk-forward periodic updating. Consequently, performance between the Static and Signal strategies will diverge.
All of the Cross Alpha strategies are built with our proprietary application of Walk-Forward Analysis. What is presented here under Current Performance is the performance of the most current WFA out-of-sample window for each strategy. Our process periodically evaluates the performance of what we call the Static version of the strategy, i.e., the performance of the optimization space, with that of the Dynamic version of the strategy, which is its performance under Walk-Forward Analysis. We select the strategy which exhibits the best current performance. This can and will change from time to time. The performance of the Static portfolio is presented next in the Historical Performance section.
Nonetheless, every Cross Alpha strategy has been validated for robustness using our proprietary application of Walk-Forward Analysis. Every strategy in the Cross Alpha portfolio has to pass this rigorous and unique process. Period.
Updated through 10-31-2023
Current Performance covers 1/2/2022 to 10-31-2023
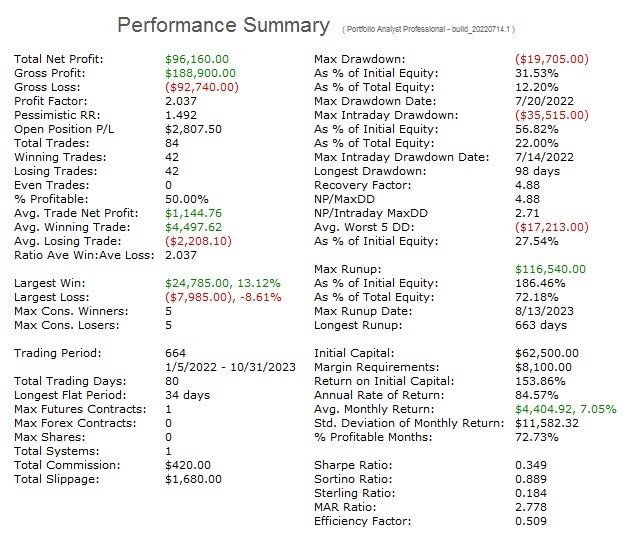
Key Statistics -
Net PL: $96,160
Current OE: $2,807
Max DD: $19,705
PL / DD 4.9
ARR: 84.6%
Ave Trade: $1,145
# Trades: 84
% Profit: 50.0%
Capital: $62,500
Capital Micro: $10,000
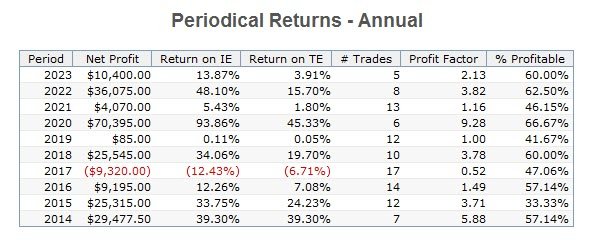
Historical Performance
Updated through 09-08-2023
Historical Performance covers 1/2/2013 to 09-08-2023
Key Statistics -
Net PL: $208,940
Max DD: $24,355
PL / DD 8.6
ARR: 29.29%
Ave Trade: $2,223
# Trades: 94
% Profit: 51.06%
Account: $75,000
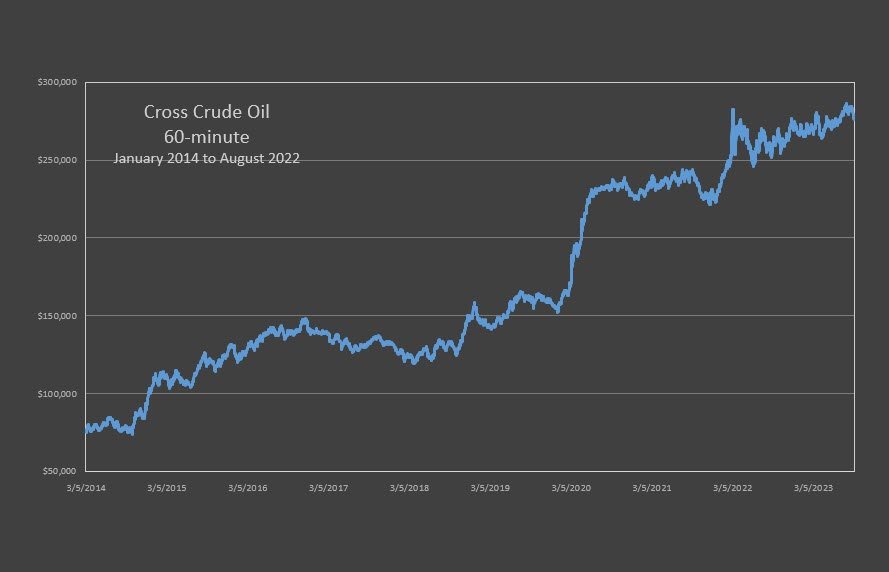
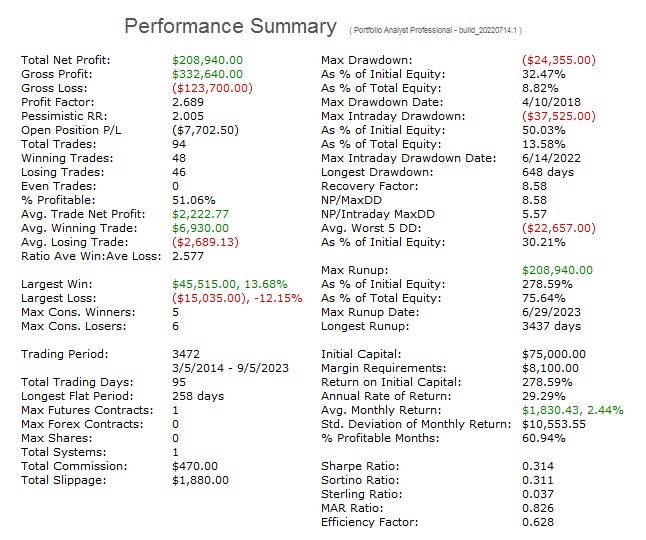
This is hypothetical performance.
Government Required Disclaimer - Commodity Futures Trading Commission states:
Futures and Options trading has large potential rewards, but also large potential risk. You must be aware of the risks and be willing to accept them in order to invest in the futures and options markets. Don't trade with money you can't afford to lose. This is neither a solicitation nor an offer to Buy/Sell futures, stocks or options on the same. No representation is being made
that any account will or is likely to achieve profits or losses similar to those discussed in this document. The past performance of any trading system or methodology is not necessarily indicative of future results.
CFTC RULE 4.41 - HYPOTHETICAL OR SIMULATED PERFORMANCE RESULTS HAVE CERTAIN LIMITATIONS. UNLIKE AN ACTUAL PERFORMANCE RECORD, SIMULATED RESULTS DO NOT REPRESENT ACTUAL TRADING. ALSO, SINCE THE TRADES HAVE NOT BEEN EXECUTED, THE RESULTS MAY HAVE UNDER-OR-OVER COMPENSATED FOR THE IMPACT, IF ANY, OF CERTAIN MARKET FACTORS, SUCH AS LACK OF LIQUIDITY. SIMULATED TRADING PROGRAMS IN GENERAL ARE ALSO SUBJECT TO THE FACT THAT THEY ARE DESIGNED WITH THE BENEFIT OF HINDSIGHT. NO REPRESENTATION IS BEING MADE THAT ANY ACCOUNT WILL OR IS LIKELY TO ACHIEVE PROFIT OR LOSSES SIMILAR TO THOSE SHOWN.